I Let a Headband Read My Brain. Here’s What It Got Right (and Wrong).
By Dana Houston Jackson, Founder and Principal Change Architect, Change – With a Coach Approach, LLC

Left to right: Nirali Rana, me and Matt Dragun at the “Reimagining Change” summit in Málaga, November 2026.
Better Than Tarot (and Yes, I’ve Done Both)
I’ve had my tarot cards read. I’ve filled out more personality assessments than I can count. Earlier this month in Málaga, I tried something new. I let a headband read my brain. Yes, an actual brain scan.
Tarot gave me a card. The brain scan gave me a Z-score. Same energy, way better graphs.
Here’s why it matters for anyone leading change. Almost every tool we use to understand people asks those people to describe themselves. A brain scan doesn’t ask. It measures. So I wanted to know what that actually buys you and what it doesn’t. This piece covers what the scan said about me, where it nailed me, where it missed, where it argued with itself and what change leaders, project managers and HR folks should take from it. I’ll explain the science in plain English as we go, and there’s a reference sheet at the end with links if you want to dig deeper.
Two Runs, Five Sensors, Zero Questionnaires
The outfit is called MindMirror. At a think-tank change leadership summit in Málaga, they put a light headband with three sensors across my forehead and clipped two more to my earlobes, five sensors in all. I did two five-minute runs with my eyes open, chatting informally with the assessor. Nothing goes into your head and there’s no questionnaire. A few days later, five reports landed in my inbox: communication, leadership, thinking style, sleep and a brain map.
What it measures is EEG, short for electroencephalography. That’s the tiny electrical rhythms your brain gives off all day long. It reads activity, not thoughts. Those rhythms get sorted by speed into five bands with Greek names. Slow delta goes with deep rest. Theta shows up in memory and tuning in to people. Alpha is calm, alert readiness. Beta is the busy hum of getting things done. Fast gamma is the brain pulling separate pieces of information together. Your brain runs all five at once, all day.
The software then compares your numbers to a database of about 3,245 scans from 954 people, split by sex and age. Most results come back as a Z-score, which just means how far you sit from the average person like you. Zero is average, 1 is a clear difference and 2 is a strong one. Finally, it turns those differences into scores, styles and labels.
A little background, from MindMirror’s own session at the summit. The tool grew out of years of work by a Dutch psychologist who scanned brain after brain, spotted patterns across people and built a model from them. Each scan reads 55 measurements across both sides of the brain. They’re clear that it’s not a medical device and not a diagnosis, and they shared that research partnerships are underway with Radboud University in the Netherlands and the University of Málaga. Their bigger point stuck with me: we spend a fortune upgrading our technology and almost nothing upgrading the human running it.
That last step, from numbers to labels, is where it gets interesting. Hold that thought.

The cover of my leadership report. Each point on the radar is one of six leadership dimensions, scored 0 to 100. Image: MindMirror.
What My Brain Says About Me
Here’s the highlight reel, in plain English so we can all understand it (I’m not a neuroscientist either).
- The Guardian, a “WHO-thinker.” Before my brain asks what we’re doing or why, it asks who’s in the room and how they’re doing. Think inner radar for people. MindMirror borrows four starting questions (WHO, HOW, WHAT and WHY) from Ned Herrmann’s Whole Brain Model, a well-known thinking-style framework that’s normally a questionnaire, and assigns each question to a brainwave band. Mine came out theta, the “who” band.
- Deep listener. Empathic 75%, intuitive 70%, analytical 50%. The gist: I hear what’s said and what’s meant. Each of the three comes from a different band and from coherence, which is how closely the left and right sides of the brain move in rhythm.
- The Doer, consensus-driven. Practical, no drama, builds buy-in before making the call. Names like “Guardian” and “Doer” are borrowed loosely from Carol Pearson’s archetypes, story characters used to describe what drives people. MindMirror says plainly that they’re metaphors, not a diagnosis.
- Connection & Empathy: 77. My top leadership score by a mile. The six leadership dimensions are tied to Henry Mintzberg’s 10 roles of a manager, a classic study of what managers actually do all day. The other five (decision-making, performing under pressure, vision, execution and self-reflection) all sit right around average, between 47 and 54. One superpower and five solid “fine, thank you very much” scores.
- Steady under pressure. My communication barely changes when things get tense. While other folks get snippy or go quiet in deadline week, I stay the same.
- Best room: a small group of 3 to 5. Then writing, then 1-on-1. Big groups come last.
If you know me, most of that tracks. I start with the people. The small-group finding made me laugh, since I give keynotes. But the work that actually changes things usually happens around a table of five, not in a ballroom.
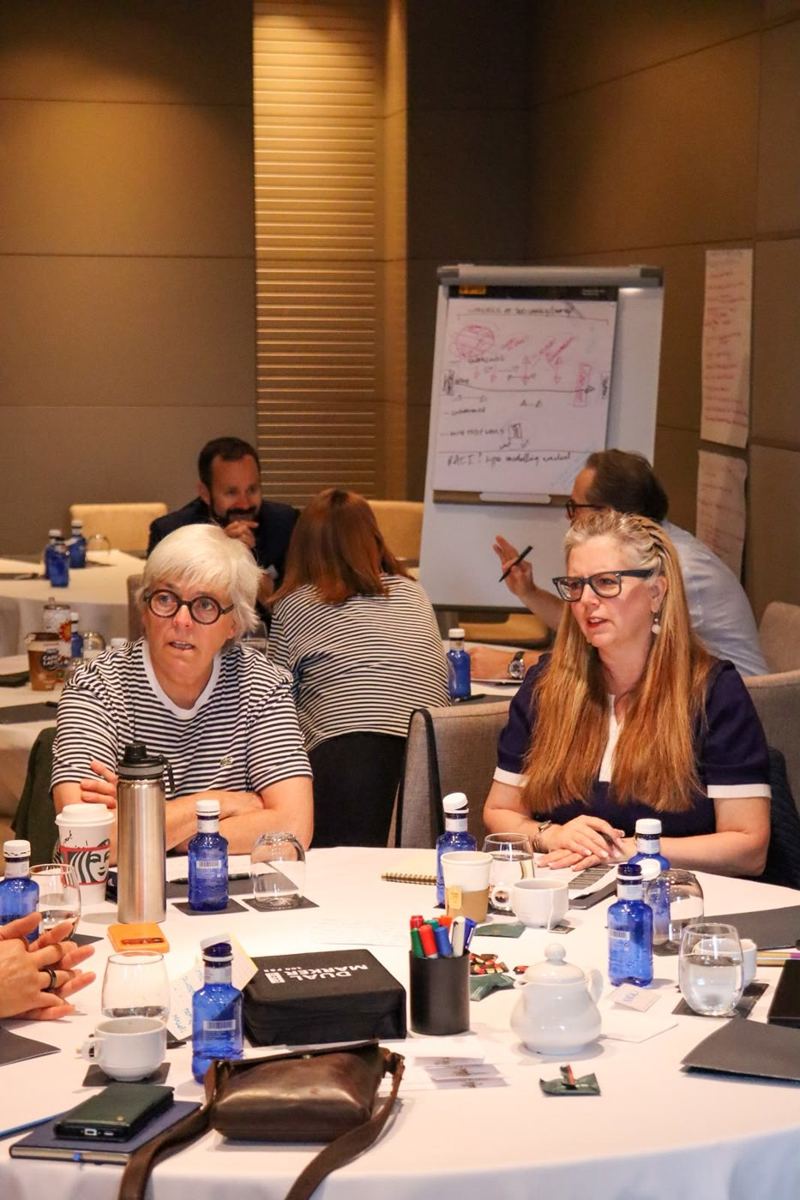
Small-group work at the summit. A table of five is where the real change conversations happen.

My thinking style. The diamond leans toward WHO, meaning my brain starts with the people. Image: MindMirror.
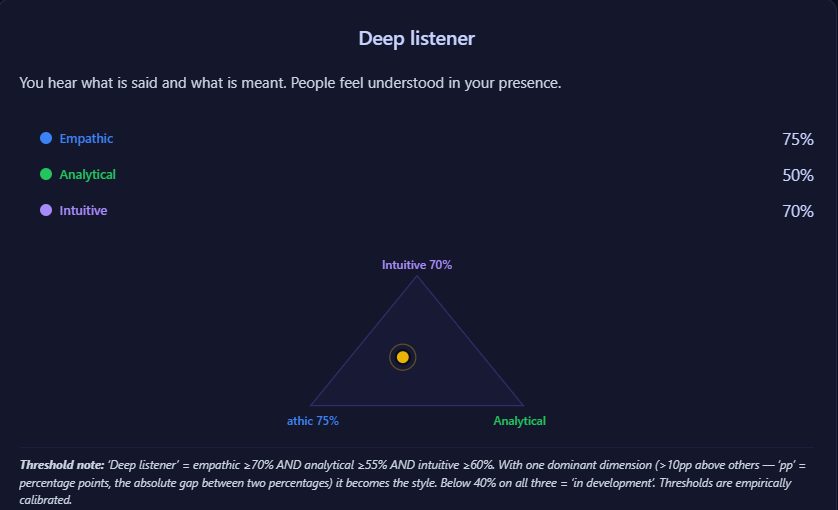
The “Deep listener” result. Keep an eye on that small print at the bottom. We’ll come back to it. Image: MindMirror.
One more label worth a look. On the Leary Rose, a model of how behavior pulls behavior out of other people, I landed in Helping-Cooperating. The up-down axis is how much influence you push. The left-right axis is how much you lean toward “we” or “me.” My dot sits just to the “we” side of center, which tracks for a coach.

Where I landed on the Leary Rose. Image: MindMirror.
Where It Nailed Me and Where It Missed
Three labels made me sit up. Each one teaches something about what a brain scan can see and what it can’t.
“Conflict avoidant”
The leadership report says strong connection plus lots of processing time adds up to conflict avoidance. I feel the tension, but I may not address it because it costs too much.
Show me someone who enjoys conflict and I’ll show you someone you don’t want running your change program. Do I like arguments? Heck no. But when a situation needs sorting, I lean in, and I keep a level head doing it. The scan can see that I feel the tension. It can’t see what I do with it. That’s a behavior, and behavior shows up in the room, not on a headband.
For coaches, this is the big one. A tendency is not a choice. The scan describes the pull. The person decides what to do about it.
“Specialist: depth, not breadth”
The communication report gave me 3 out of 10 “active connections” and called me a specialist. I go deep on a topic and miss little, but connections across fields don’t come automatically.
Half right. When a subject grabs me, I go all the way down the rabbit hole and keep learning. But connecting disciplines, viewpoints and concepts is my entire job. I pull org design, AI, change and five generations of workers into one picture so we can interpret what’s in front of us and predict what’s coming. The report itself says this measure swings with fatigue and stress, and I was mid-conference and five days off a transatlantic flight.
Going deep isn’t the opposite of connecting dots. It’s how you find the dots worth connecting.
“Persuasiveness: 34%”
My lowest number. Their read is that my ideas are connected in my head, but the bridge steps stay unspoken, so people get my conclusion without my reasoning. The tip is to say “I think X because Y.” That’s good advice for anybody, and I’ll take it.

How I “come across,” per the communication report. Image: MindMirror.
But it raises a bigger question. What does it mean to persuade somebody? Nobody can force another person to change their mind or their behavior. What we can do is present stories, ideas and options. Then people decide for themselves. That’s the whole premise of a coach approach to change.
Here’s what’s actually behind the number. Gamma is the fastest brainwave band, the one tied to fusing separate pieces of information into one story. The persuasiveness score measures how tightly the lower part of my gamma rhythm lines up between left and right. That’s a long way from whether people choose to follow you. A brain signal can hint at how you package an idea. It can’t measure whether the idea moved anyone.
When the Machine Argued With Itself
This part I found the most useful, and it’s why I’d read any brain-scan report with a pencil in hand.
- Three empathy verdicts in one day. The thinking-style report says I have a “strong empathic antenna.” The leadership report’s raw bars say feeling along with others is “less pronounced.” My Connection score is 77. Same brain, same day. The answer depends on which formula is holding the pen.
- One number went from 75% to 34% in the same sitting. I had two scans that day. The integration measure behind “Connection” read 75% on the first and 34% on the second. Scientists check this with test-retest reliability: measure twice, see if you get the same answer, and score it from 0 to 1. Anything under 0.75 is only moderate. MindMirror’s own numbers put their slower bands at an excellent 0.98 and the gamma band at 0.62. So the stuff built on gamma moves around a lot.
- A label that breaks its own rule. “Deep listener” requires an analytical score of 55% or higher. I scored 50% and got the label anyway. I’ll take it because it’s true.
- Two numbers for one fact. The theta-to-beta ratio compares a slow band to a faster one. One line says mine is higher than 91 out of 100 people. The next says higher than 8 in 10. The same section cites a 2013 research review that found this ratio isn’t reliable for sorting individuals.
- A learned style that doesn’t fit the top score. The leadership report says I’ve learned to lead as a “Commander + Visionary,” a style that supposedly asks little about how others are feeling. That’s a strange fit for someone whose highest score is Connection.

Exhibit A for item 1: “Feeling along with others” reads less pronounced here, while the same report scores my Connection at 77. Image: MindMirror.
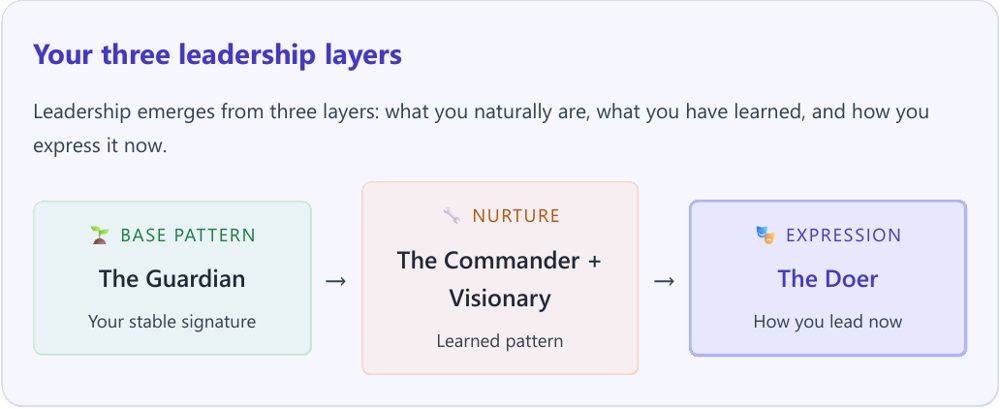
Exhibit B for item 5: the learned “Commander + Visionary” layer sits between a people-first base and a consensus-driven style. Image: MindMirror.
Now, here’s what I want to be fair about. I found every one of these because MindMirror told me where to look. Each report has a section on what they can’t claim. They flag which pieces come from published research and which are their own working model. They even admit the exact sensor positions haven’t been validated yet. I’ve never seen a paper-and-pencil assessment vendor put that in writing. That transparency is the best thing about the product.
Brain Scan vs. Self-Report: Same Lens, Different Input
Here’s the twist I didn’t expect. Under the hood, the brainwave numbers get poured into the same frameworks we already use with questionnaires. If you’ve been through leadership development, you’ve probably met a few of them:
- Herrmann’s Whole Brain quadrants: four thinking preferences, usually measured with a 116-question survey.
- The Leary Rose: a map of how one person’s behavior pulls a certain behavior out of another.
- The Johari Window: what you know about yourself, what others see that you don’t, what you keep hidden and what nobody knows yet.
- Pearson’s archetypes: twelve story characters for what drives people.
- Mintzberg’s management roles: ten roles managers play, from figurehead to negotiator.
Even Herrmann’s own company says its four quadrants are a metaphor for thinking preferences, not a map of brain anatomy. MindMirror maps brainwave bands onto them anyway.
So the scan didn’t replace the lens. It swapped the input.
That’s why it helps to read a brain-scan report in three layers, and trust each one differently.
| Layer | What it is | How much to trust it |
|---|---|---|
| Raw signal | The electrical rhythms, sorted by speed | High. Their slower-band readings repeat at 0.98 on a 0-to-1 scale |
| Comparison | Your numbers vs. their database, by sex and age | Medium. It’s their own database, not a public standard |
| Interpretation | “Guardian,” “Doer,” “Deep listener” | Low to medium. In their words, a working model that isn’t externally validated |
And here’s how the two approaches stack up side by side.
| Self-report assessment | Brain scan (EEG) | |
|---|---|---|
| What it captures | What you believe about yourself and are willing to say | What your nervous system was doing for five minutes |
| Biggest strength | Your story, values and context. Well-known tools have decades of research behind them | You can’t spin it. It picks up load and recovery you may not notice |
| Biggest blind spot | Your blind spot stays blind. Mood and “what’s the right answer?” creep in | It’s a snapshot. Travel, fatigue and caffeine move the numbers. It can’t tell you why |
| What it’s good for | Starting a conversation about preferences | Starting a conversation about state and patterns |
To be fair to questionnaires, the classic knock on them is social desirability bias, the pull to answer the way you think you should. But research on well-built tools shows it does less damage than you’d think. And to be fair to the scan, numbers measured to the hertz are real data. But measured isn’t the same as meaningful. The jump from “your theta is high” to “you’re a Guardian” is a judgment call made by whoever wrote the formula.
Neither tool tells you who you are. Self-report tells you who you think you are. A brain scan tells you how your nervous system showed up that day. The insight lives in the gap between the two, and in the conversation about it.
If You Were Building a Team Around Me
Here’s where a profile like this gets practical. Not as a hiring screen (MindMirror itself says don’t), but as a conversation starter about fit. So let me use my own as the example.
Put me where people decide whether change sticks. Change leadership, adoption work, facilitation, coaching and any room where buy-in matters more than speed. A table of 3 to 5 people is my sweet spot.
Pair me with a closer. I’ll hear everyone before I decide. Give me a WHAT-thinker who’ll call it when consensus stalls, and a sparring partner who challenges my thinking instead of nodding along. That’s straight from my report, and it’s good advice.
If you’re interviewing me, know this. I’ll ask about your people before your plan. I stay steady when the heat is on. Give me a deadline and I’ll make the call, with or without perfect agreement.
Where I’d wilt. Roles that are all solo execution with no people in the loop, or big crowds all day with no small-group work to balance it out.
How to Use Your Own Profile
Whether yours came from a brain scan or a questionnaire, here’s how to put it to work.
- Find your one clear strength and check it against your story. Does it match what people already come to you for? If not, trust the story and question the report.
- Use it to ask better questions when you interview. “How does this team make decisions?” and “Who calls it when there’s no agreement?” tell you more about fit than any job title.
- Look for the gap you need filled, not just the role you want. My report says I need a closer. Knowing that, I can look for teams that already have one.
- HR leaders, design for teams, not labels. Offer it opt-in, let the person own the data and use it to round out a team, never to screen someone out.
What This Means If You Lead Change
If you’re a change leader, a project manager pushing work over the finish line or an HR leader picking tools for your people, here’s my take.
- Use it as a mirror, not a verdict. MindMirror says it in every report: not for hiring, promotion or selection. Believe them. The minute a brain scan becomes a gate, people stop being curious about it.
- Ask for two scans, not one. They recommend at least two, two to four weeks apart. One scan is a weather report, not the climate.
- Use it to design teams, not just to read individuals. In MindMirror’s session, they described a five-person startup that scanned everyone before replacing a founder who was leaving. They learned the departing founder didn’t actually have the skill everyone assumed he did. That’s a hiring mistake avoided before it happened.
- Pair it with self-report and other people’s view. The scan brings the body’s data. The person brings the story. A 360 brings what others see. You need all three to get anywhere near the truth.
- Read the confidence, not just the label. Ask the vendor straight out: which of these findings are published science and which are your model? If they can’t tell you, that’s your answer.
- Watch for state vs. trait. A scan taken in the middle of a reorg, a launch or an AI rollout may be showing you the change load, not the person. That might be the most interesting use for change folks. Not “who is this person?” but “how loaded is this team right now?”
- Treat brain data like the personal data it is. Know where it’s stored, who sees it and how long it’s kept before anybody straps on a headband. MindMirror shared a model I love: a Dutch installation company paid for monthly scans for its field workers as a burnout-prevention program, but the company never saw the data. The workers kept it and agreed to act if their own numbers slipped. Per MindMirror, people came back from burnout faster and relapsed less. The employer paid. The employee owned it. That’s how trust gets built.
And before you bring any assessment, brain-based or not, into your change effort, ask yourself a few questions. What decision will this help us make? Who gets to see the results? What happens when the report and the person disagree? If you can’t answer those, you’re putting the cart before the horse.
So, Would I Do It Again?
Yes. It was more fun than tarot and more useful than most questionnaires, mostly because it gave me something to argue with. Next time, I’d do two scans a few weeks apart and bring a self-assessment to compare side by side.
The headband got a lot right. I start with people. I listen for what’s meant. I stay steady when the heat is on. Where it missed, it missed on the things that only show up in behavior: how I handle a hard conversation, how I connect ideas across fields and how I help people make up their own minds.
Data can start the conversation. It takes a human to finish it.
Curious what a brain-based or traditional assessment could do for your team’s next change? Schedule a time with Dana.
Reference Sheet: Plain-Language Glossary
The reports name-drop a lot of science. Here’s what each piece means, in one or two sentences, with a link if you want to dig in.
The company: MindMirror ran my scan and produced the reports quoted in this article.
The measurement
- EEG (electroencephalography): Sensors on the scalp pick up the brain’s tiny electrical signals. It measures activity, not thoughts, and sends nothing into your head. Learn more
- Brainwave bands (delta, theta, alpha, beta, gamma): Brain rhythms grouped by speed, from slow delta (deep rest) to fast gamma (pulling information together). Your brain runs all of them at once. A band is never an on-off switch. Learn more
- Sub-bands (theta-1, alpha-2 and so on): Each band split into a lower and an upper half. MindMirror gives each half its own meaning, like “survive” vs. “grow.” Those meanings are their own working model.
- Coherence: How closely two sensors move in rhythm. 0 means unrelated and 1 means identical. Higher is often read as better teamwork between brain areas, but it’s sensitive to setup. Learn more
- Z-score: How far your number sits from the average of the comparison group. 0 is average. Plus or minus 1 is a clear difference. Plus or minus 2 is a strong one.
- Test-retest reliability (ICC): Do you get the same answer if you measure twice? On a 0-to-1 scale, under 0.5 is poor, 0.5 to 0.75 is moderate and above 0.9 is excellent. Learn more
The brain science the reports lean on
- Theta/beta ratio: Slow theta compared to faster beta. It was once floated as an ADHD marker, but a 2013 research review found the gap shrinking over the years and the ratio not reliable for classifying individuals. Learn more
- Frontal alpha asymmetry (Davidson): Comparing left vs. right activity at the front of the brain. More left-side activity is linked to “approach” motivation and more right-side activity to “withdraw.” It’s one of the best-studied EEG markers. Learn more
- Theta-gamma coupling (Lisman & Jensen): Slow theta and fast gamma rhythms working together, a likely way the brain holds and orders several pieces of information at once. MindMirror uses it as a stand-in for “aha” moments. Learn more
- Field dependence and independence (Witkin): A thinking style from the 1970s. Field-dependent folks read the context and the people around them. Field-independent folks pull a problem apart on their own. Neither is better. Learn more
- Left-right brain coherence and thinking style (Hao 2013): A study linking how in-sync your two hemispheres are to that field-dependent or field-independent style. Learn more
- Sensory processing sensitivity (Aron): The “highly sensitive person” trait. Roughly 15 to 20% of people process what’s around them more deeply. It’s a trait, not a disorder. Learn more
- Tend-and-befriend (Taylor 2000): A stress response that’s more common in women: protect your people and reach out for support, rather than just fight or flight. Learn more
The leadership and personality models
- Herrmann Whole Brain Model (HBDI): Four thinking preferences (analytical, practical, relational and experimental), usually measured with a questionnaire. Herrmann’s own company calls the quadrants a metaphor, not brain anatomy. Learn more
- Leary Rose (interpersonal circumplex): A map of behavior on two axes: above vs. below (influence) and together vs. against (relationship). Its point is that behavior triggers behavior. Learn more
- Johari Window (Luft & Ingham, 1955): Four panes: what you and others both know about you, what only others see (your blind spot), what you keep hidden and what nobody knows yet. Sharing and asking for feedback grow the open pane. Learn more
- Pearson’s archetypes: Twelve story characters (Caregiver, Ruler, Sage and others) used to describe what drives people. MindMirror clusters brain patterns into archetype names like “The Guardian” as a metaphor, not a diagnosis. Learn more
- Mintzberg’s 10 managerial roles: What managers actually do, grouped into interpersonal, informational and decisional roles. Figurehead, monitor, negotiator and the like. Learn more
- Leadership derailers (Hogan): Strengths that turn into liabilities under stress, like drive tipping into ruthlessness. MindMirror’s “blind spots” borrow this idea but haven’t been checked against Hogan’s tool. Learn more
- Social desirability bias: The pull to answer a questionnaire the way you think you should, on purpose or not. It’s the classic knock on self-report tools. Learn more
Quick Answers: Brain Scans and Leadership Assessment
Can a brain scan replace a personality assessment?
No. A brain scan swaps the input, not the lens. An EEG shows how your nervous system showed up for a few minutes, while a questionnaire shows how you see yourself. Use both, and add a 360 for how others see you.
How accurate is an EEG brain scan leadership assessment?
The raw signal is fairly repeatable. MindMirror reports 0.98 reliability for its slower brainwave bands, but only 0.62 for the fast gamma band, and the labels built on top are the vendor’s own working models. Treat the labels as conversation starters, not facts. For more on measuring what matters, see The Hard Truth About Change Management Metrics.
Should HR use brain scans for hiring?
No. MindMirror’s own reports say not to use them for hiring, promotion or selection. Offer scans opt-in, let employees own their data and use the results for development and team design.
What does a 5-minute EEG brain scan actually measure?
Three sensors on the forehead, plus two on the earlobes (five in all), record the brain’s electrical rhythms. The software sorts them into delta, theta, alpha, beta and gamma bands and compares them with a database of other people of the same sex and age. It reads activity, not thoughts.
How can change leaders use brain scan results?
Use them to design teams, to notice change load during a reorg or AI rollout and to start honest conversations about how people work. Pair them with what people tell you and what you see in the work. Related: It’s Not a Tech Problem: What Adaptive Leadership Knows About Making AI Work and AI Adoption Is a Lot Like Raising Kids.
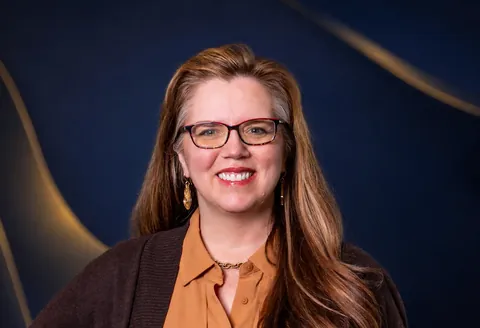
Dana Houston Jackson is Founder and Principal Change Architect of Change – With a Coach Approach, LLC, author of The AI Adoption Traps and co-author of the upcoming Leading a Five-Generation Workforce (April 2027). A straight-talking Texan with 30 years of experience, she helps leaders make change less confusing, less painful and far more useful. She holds a master’s degree in Organizational Change Leadership and is a PMP, CCMP, Prosci trainer and ICF Professional Certified Coach. Visit changewithacoachapproach.com or connect on LinkedIn at linkedin.com/in/danahoustonjackson.